Statistical Methods in Quality Management
Module 4
Core Concepts
- Quality management ensures products, services, and processes consistently meet or exceed customer expectations.
- Statistical methods provide essential data-driven tools for monitoring, analysis, process control, and improvement within quality management.
- Effective interpretation of data using statistical techniques is crucial for identifying deviations and guiding corrective actions.
- Statistical Process Control (SPC) is a core methodology employing statistical tools like control charts to monitor process stability and variability.
- The application of these methods facilitates process control and underpins continuous improvement efforts in organizations.
Key Term Definitions
- Quality Management: A formalized system that documents processes, procedures, and responsibilities for achieving quality policies and objectives, focusing on consistency and customer satisfaction.
- Statistical Methods: The application of statistical techniques (data collection, analysis, interpretation, presentation) to solve problems and make decisions, particularly in process monitoring and improvement.
- Process Control: The use of statistical tools and procedures to monitor process performance, identify variations, and maintain the process within desired operating limits.
- Continuous Improvement (Kaizen): An ongoing effort to improve products, services, or processes, often involving incremental changes based on data analysis.
- Statistical Process Control (SPC): A specific quality control methodology using statistical methods (especially control charts) to monitor and control a process, aiming to ensure it operates efficiently and produces conforming products.
Hypothesis Testing
Hypothesis Testing - Definition
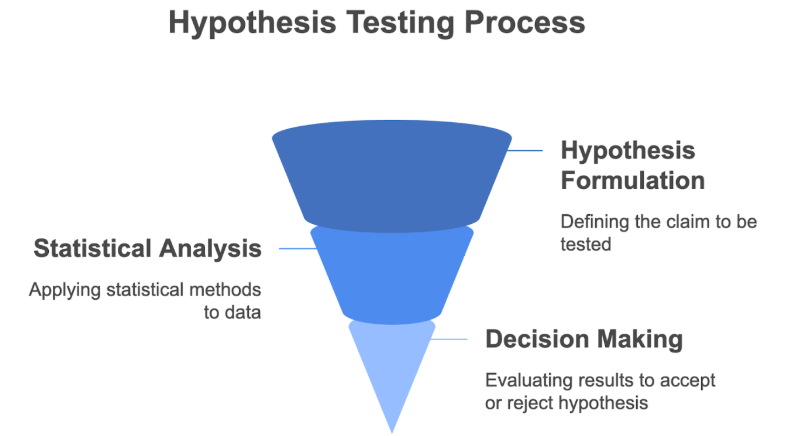
A statistical procedure used to evaluate claims or hypotheses about a population or process based on sample data. In quality management, it often tests whether a product or process meets specified standards.
Hypothesis Testing - Key Insights
- Helps make objective decisions about product/process quality (e.g., accept/reject batch).
- Requires understanding and balancing the risks of:
- Type I Error: Incorrectly rejecting a true hypothesis (e.g., rejecting a good batch).
- Type II Error: Incorrectly failing to reject a false hypothesis (e.g., accepting a defective batch).
- Both error types have potential financial and reputational consequences.
Hypothesis Testing - Examples
- A manufacturer testing if the mean tensile strength of a material meets the minimum required specification.
- Verifying if a process change has significantly reduced the defect rate.
Regression Analysis
Regression Analysis - Definition
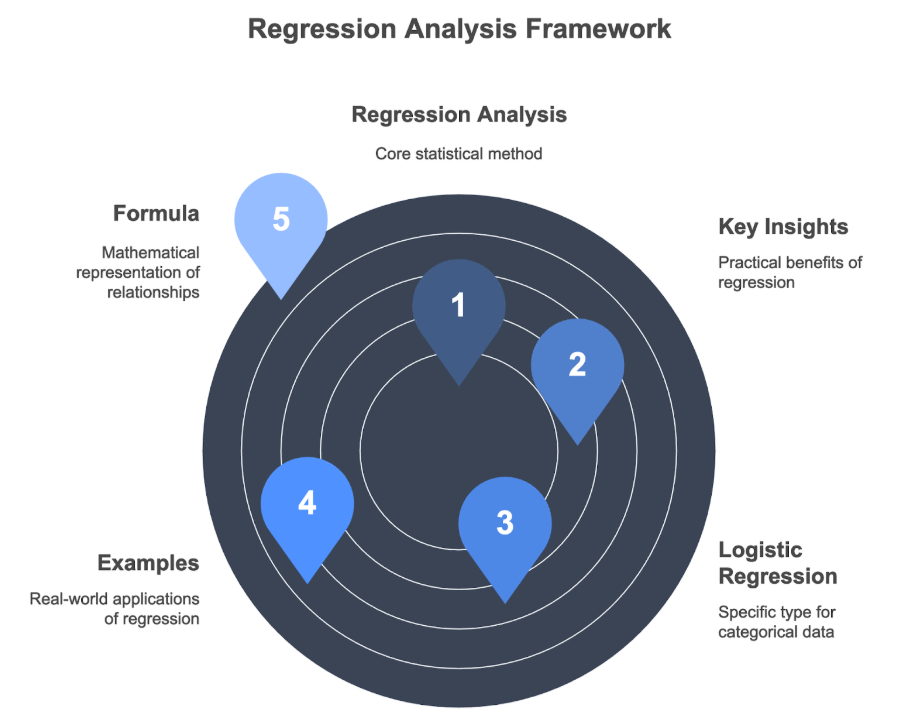
A set of statistical processes for estimating the relationships between a dependent variable (output/outcome) and one or more independent variables (inputs/factors).
Regression Analysis - Key Insights
- Identifies and quantifies how changes in input factors affect process outputs or product quality characteristics.
- Enables prediction of future outcomes based on input variable values.
- Facilitates process optimization by understanding key influential factors.
- Logistic Regression: A specific type used when the dependent variable is categorical (e.g., pass/fail, defective/non-defective).
Regression Analysis - Examples
- Modeling how furnace temperature and curing time affect the hardness of a material.
- Predicting the likelihood of a product passing inspection based on sensor readings during production.
Regression Analysis - Formula (Conceptual)
- Represents the relationship mathematically, often as an equation predicting the dependent variable based on coefficients multiplied by independent variables (e.g.,
Output ≈ β₀ + β₁ * Input₁ + β₂ * Input₂ + ...).
Statistical Process Control (SPC) and Control Charts
SPC and Control Charts - Definition
A method of quality control which employs statistical methods to monitor and control a process, ensuring it operates at its full potential to produce conforming product. Control charts are the primary tool.
SPC and Control Charts - Key Insights
- Control Charts: Graphical displays of process data over time plotted against statistically derived limits.
- Key components: Central Line (CL) (process average), Upper Control Limit (UCL), and Lower Control Limit (LCL) (bounds for expected variation).
- Distinguishes between:
- Common Cause Variation: Natural, inherent process variability (system is stable).
- Special Cause Variation: Unexpected variability due to specific identifiable causes (system is unstable, requires action). Points outside limits or non-random patterns signal special causes.
SPC and Control Charts - Examples
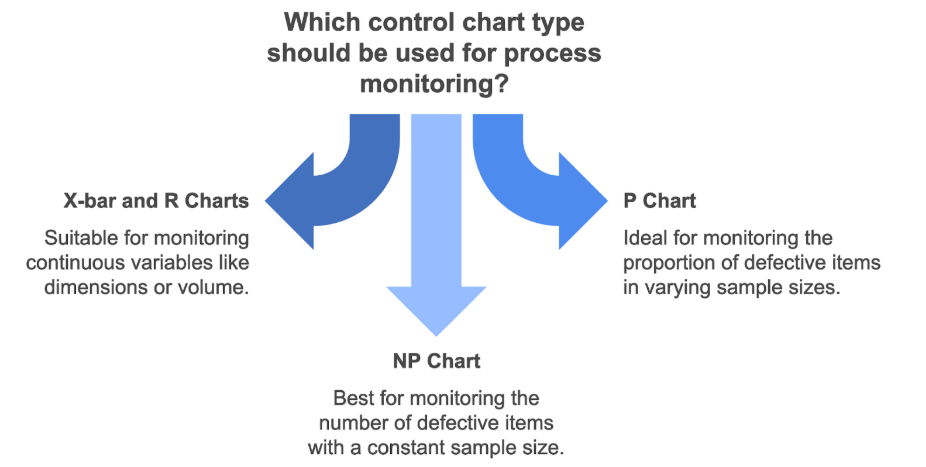
- X-bar and R Charts: Monitor the average (X-bar) and range (R) of a continuous variable (e.g., part dimension, fill volume).
- P Chart: Monitors the proportion of defective items in samples of varying sizes (e.g., percentage of non-conforming units per batch).
- NP Chart: Monitors the number of defective items when the sample size is constant (e.g., count of errors per inspected form).
SPC and Control Charts - Comparisons
- Different chart types are selected based on the type of data being monitored (continuous/variable vs. discrete/attribute) and the sampling strategy.
SPC and Control Charts - Formula (Conceptual)
- Control limits (UCL/LCL) are typically calculated based on the process average and its variability (e.g.,
CL ± 3 * Standard Deviations).
Decision Trees for Quality Control
Decision Trees for Quality Control - Definition
A flowchart-like structure used as a predictive model or decision support tool, where each internal node represents a test on an attribute, each branch represents the outcome of the test, and each leaf node represents a decision or classification.
Decision Trees for Quality Control - Key Insights
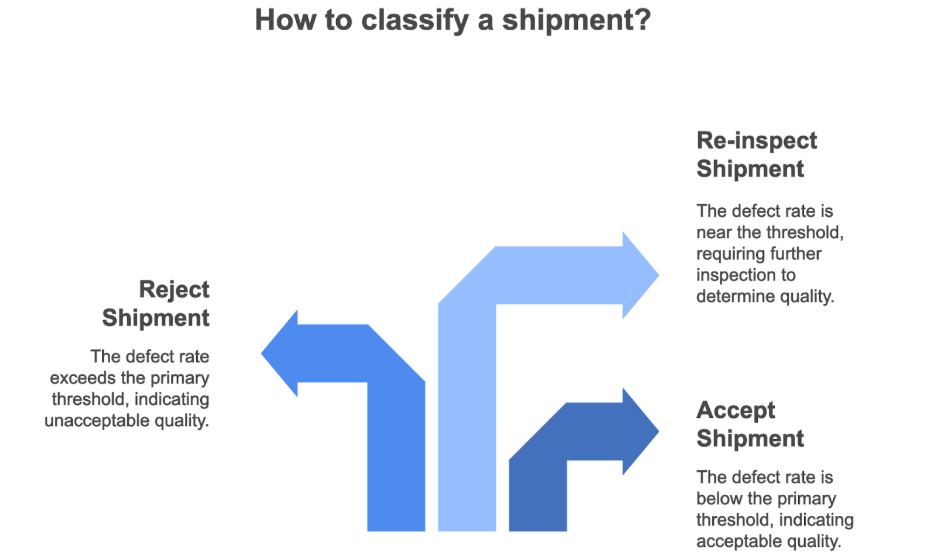
- Provides a structured, visual approach for making sequential decisions (e.g., approve, reject, re-inspect) based on observed data like defect rates.
- Decision criteria (thresholds) are often established using historical data, statistical analysis (e.g., percentile approach), or cost-benefit analysis.
- Can be used to automate classification decisions for new batches or items.
Decision Trees for Quality Control - Examples
- A system deciding whether to accept a shipment based first on defect rate, then potentially on defect severity if the rate exceeds a primary threshold.
Design of Experiments (DOE)
Design of Experiments (DOE) - Definition
A systematic methodology to structure inquiries and analyze the effect of varying multiple input factors (independent variables) simultaneously on an output (dependent variable).
Design of Experiments (DOE) - Key Insights
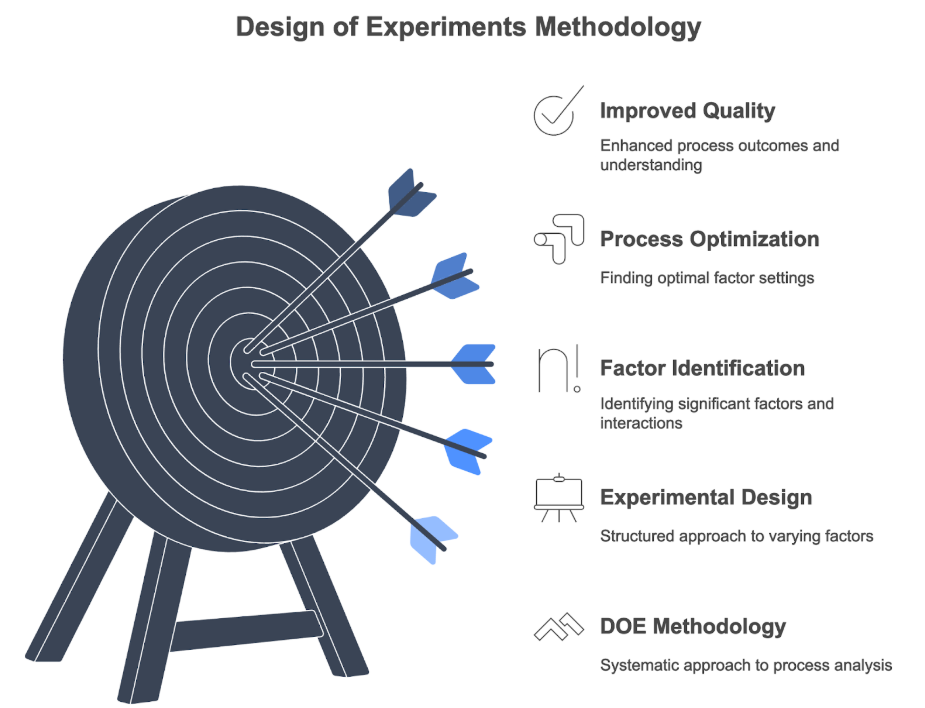
- Identifies which factors significantly impact process outcomes and quantifies their effects, including interactions between factors.
- Enables process optimization by finding the best combination of factor settings.
- More efficient and informative than changing one factor at a time or using trial-and-error.
- Leads to improved quality, reduced costs, and increased process understanding.
Design of Experiments (DOE) - Examples
- Optimizing a chemical reaction yield by simultaneously varying temperature, pressure, and catalyst concentration according to a planned experimental design.
- Improving the print quality of a machine by testing different settings for speed, ink flow, and substrate type.
Design of Experiments (DOE) - Comparisons
- Superior to informal or "one-factor-at-a-time" (OFAT) experimentation, which can miss interactions and be less efficient.
Conclusion
Statistical methods form an integrated framework for robust quality management. Hypothesis testing validates adherence to standards, while regression analysis elucidates factor-impact relationships for prediction and optimization. SPC, via control charts, provides continuous process monitoring for stability, decision trees offer structured classification rules, and DOE enables systematic process improvement by efficiently exploring factor effects. Together, these tools empower organizations with data-driven insights for enhancing consistency, efficiency, and overall product/service quality.