Advanced Statistics for Business
Predictive Analysis
Module 3
Core Concepts
- Predictive analysis utilizes historical data, statistical algorithms, and machine learning to forecast future trends and outcomes, enabling data-driven decisions.
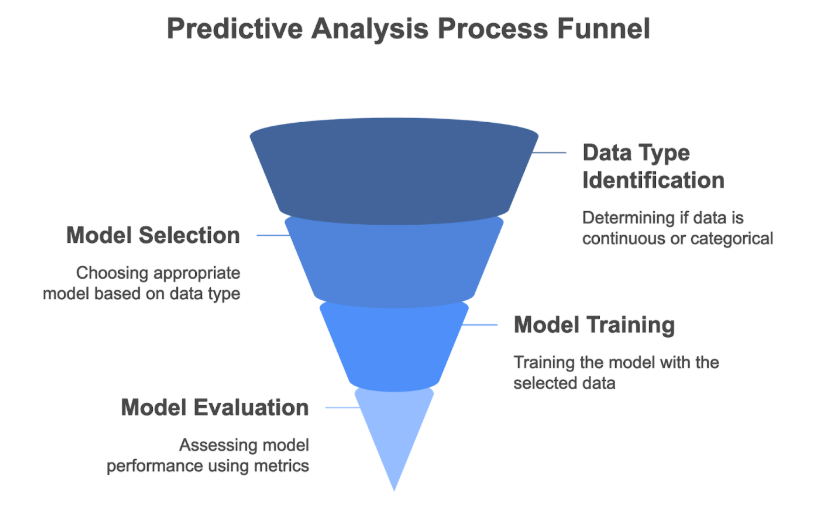
- The choice of analytical method depends critically on the data type (continuous or categorical) and whether the data exhibits time-dependent structures like trends or seasonality.
- Time series analysis specifically addresses data collected sequentially over time, focusing on patterns like trend and seasonality for effective forecasting.
- Evaluating forecast accuracy using appropriate metrics and validation techniques (like time-series cross-validation) is essential for model selection and reliability.
- Proficiency involves understanding theoretical principles, applying methods, interpreting results, evaluating assumptions, and using statistical software effectively.
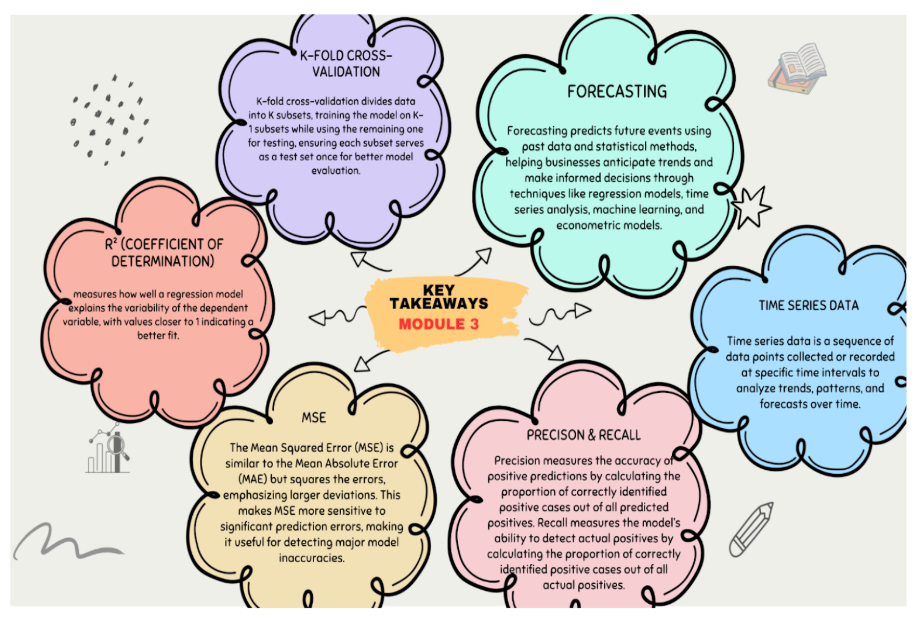
Definitions of Key Terms
- Predictive Analysis: The use of data, statistical algorithms, and machine learning techniques to identify the likelihood of future outcomes based on historical data.
- Time Series Data: A sequence of data points collected or recorded at specific, regular time intervals, where the order of observations is significant.
- Trend: The long-term direction or movement in a time series, indicating a general increase, decrease, or stagnation over time.
- Seasonality: Patterns or fluctuations in time series data that repeat over a fixed period (e.g., daily, weekly, yearly).
- Autocorrelation: The correlation of a time series with lagged versions of itself, measuring how observations are related to preceding observations.
- Cross-validation: A technique for assessing how the results of a statistical analysis will generalize to an independent data set. For time series, this typically involves training on earlier data and testing on later data.
Handling Data Types in Predictive Analysis
Continuous Data Forecasting
- Definition: Forecasting variables that can take any value within a given range.
- Key Insights: Linear regression is a common technique, modeling the relationship between a continuous dependent variable and one or more predictors.
- Examples: Forecasting sales figures, house prices, temperature.
- Formula (Linear Regression):
- Evaluation Metrics:
- MAE (Mean Absolute Error): Average absolute difference between predicted and actual values. Formula:
- MSE (Mean Squared Error): Average squared difference between predicted and actual values. Formula:
- RMSE (Root Mean Squared Error): Square root of MSE, providing error in original units. Formula:
- R-squared: Proportion of variance in the dependent variable predictable from the independent variables.
Categorical Data Forecasting
- Definition: Forecasting variables that fall into a limited number of distinct categories.
- Key Insights: Logistic regression is often used for binary outcomes (two categories), modeling the probability of an event occurring.
- Examples: Predicting customer purchase (yes/no), loan default (yes/no), patient diagnosis (positive/negative).
- Formula (Logistic Regression - Log Odds): (where p is the probability of the event).
- Evaluation Metrics:
- Confusion Matrix: Table summarizing performance (True Positives - TP, True Negatives - TN, False Positives - FP, False Negatives - FN).
- Accuracy: Overall correct predictions. Formula:
- Precision: Proportion of positive predictions that were correct. Formula:
- Recall (Sensitivity): Proportion of actual positives correctly identified. Formula:
- F1 Score: Harmonic mean of Precision and Recall. Formula:
- AUC-ROC Curve: Area Under the Curve plotting True Positive Rate vs. False Positive Rate, measuring discriminative ability.
- Quadratic Score (Brier Score): Measures accuracy of probabilistic predictions. Formula: (where Actual Outcome is 0 or 1).
Time Series Forecasting Methods
Characteristics of Time Series Data
- Definition: Data points ordered chronologically at specific intervals.
- Key Insights: The temporal order is crucial. Analysis often involves identifying and separating components like trend and seasonality from the raw data to build effective forecasting models.
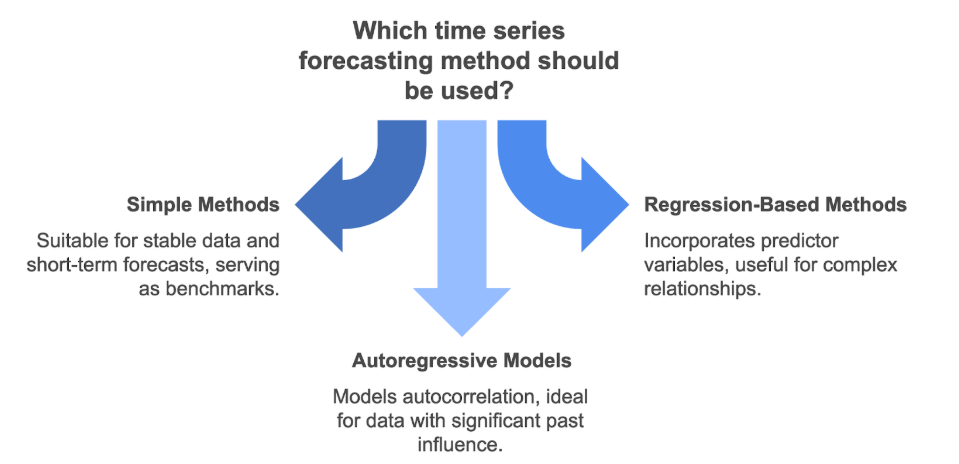
Simple Forecasting Methods
- Definition: Basic techniques making simple assumptions about data patterns.
- Key Insights: Serve as benchmarks and are useful for stable data or short-term forecasts. Vary in how they use past data (most recent, average, weighted average, trend).
- Examples:
- Naive Method: Forecast = Last observed value.
- Seasonal Naive Method: Forecast = Value from the same period in the previous season.
- Average Method: Forecast = Average of all past observations.
- Weighted Average Method: Forecast = Weighted average, often giving more weight to recent data.
- Drift Method: Forecast = Last value + average change between observations.
- Exponential Smoothing: Forecast = Weighted average giving exponentially decreasing weights to older observations. Formula (Simple Exponential Smoothing):
Regression-Based Methods
- Definition: Applying regression models (Linear, Logistic) to forecast time series data.
- Key Insights: Can incorporate predictor variables. Standard regression may not inherently account for time series properties like autocorrelation; adjustments or time-specific models might be needed.
- Examples: Using time itself or lagged variables as predictors in linear regression; using logistic regression for binary time series outcomes.
Autoregressive (AR) Models
- Definition: Models that use a linear combination of past values of the time series itself to predict future values.
- Key Insights: Directly models the autocorrelation structure. The 'order' (p) indicates how many lagged values are used. High autocorrelation at a specific lag suggests that lag might be important in an AR model (e.g., lag 1 for AR(1)).
- Formula (AR(p) Model Structure): (where is the value at time t, are lagged values, are coefficients, c is a constant, and is error).
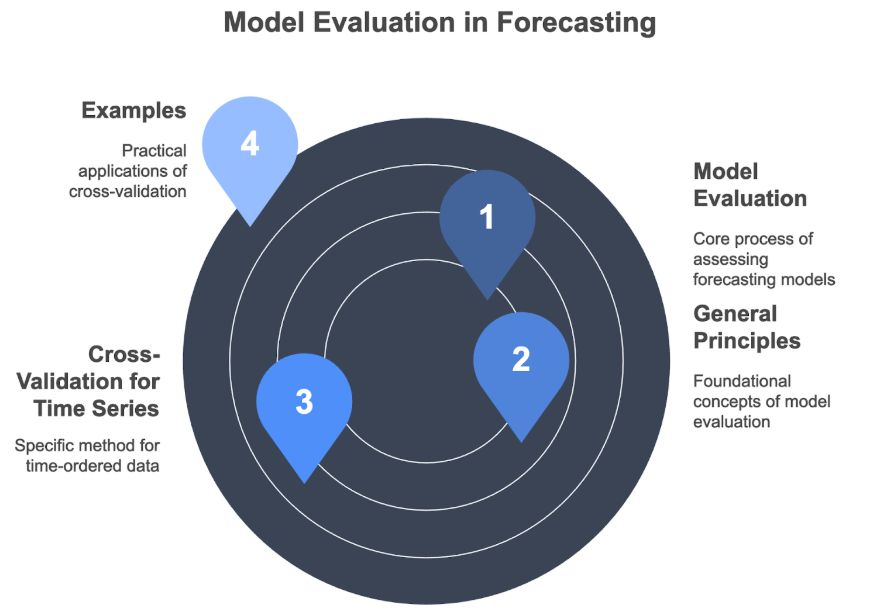
Model Evaluation in Forecasting
General Principles
- Definition: The process of assessing the accuracy and reliability of forecasting models.
- Key Insights: Essential for comparing the performance of different forecasting methods and selecting the most suitable one for a given task.
Cross-Validation for Time Series
- Definition: A specific validation approach for time-ordered data.
- Key Insights: Standard k-fold cross-validation is usually inappropriate as it ignores the temporal order. Time series cross-validation typically involves using an initial part of the series for training and a subsequent part for testing, mimicking real-world forecasting where predictions are made for the future based on the past.
- Examples: Training on data from Year 1-3, testing on Year 4. Using metrics like RMSE on the test set to compare model performance.
Conclusion
Predictive analysis provides methodologies to forecast future outcomes by leveraging historical data patterns. The approach varies based on data characteristics, with distinct techniques for continuous (e.g., linear regression) and categorical (e.g., logistic regression) variables. Time series data requires specialized methods (e.g., simple methods, AR models) that account for temporal dependencies like trend, seasonality, and autocorrelation. Rigorous evaluation using appropriate metrics and time-sensitive cross-validation is paramount to ensure the chosen forecasting model is accurate and reliable for decision-making.