Advanced Statistics for Business
Advanced Regression Methods
Module 2
Core Concepts
- Advanced regression methods extend beyond simple linear regression to handle complex datasets characterized by non-linearity, large size, multicollinearity, or potential overfitting.
- The primary objective is to build more reliable and accurate predictive models applicable across diverse fields like healthcare, business, and social sciences.
- Variable selection is crucial for simplifying models while maintaining predictive power, enhancing interpretability, and improving computational efficiency.
- Techniques involve understanding theoretical principles, applying methods to data, interpreting outputs accurately, and evaluating model assumptions for reliability.
- Proficiency in statistical software is essential for implementing these methods in real-world scenarios.
Definitions of Key Terms
- Advanced Regression Methods: Statistical techniques used for modeling relationships when assumptions of simple linear regression are violated or data complexity requires more sophisticated approaches (e.g., non-linear patterns, binary outcomes).
- Multicollinearity: A situation where two or more predictor variables in a regression model are highly correlated, making it difficult to distinguish their individual effects on the dependent variable.
- Overfitting: A modeling error where a model learns the detail and noise in the training data to the extent that it negatively impacts the performance of the model on new data.
- Variable Selection: The process of choosing a subset of relevant predictor variables to be used in building a statistical model.
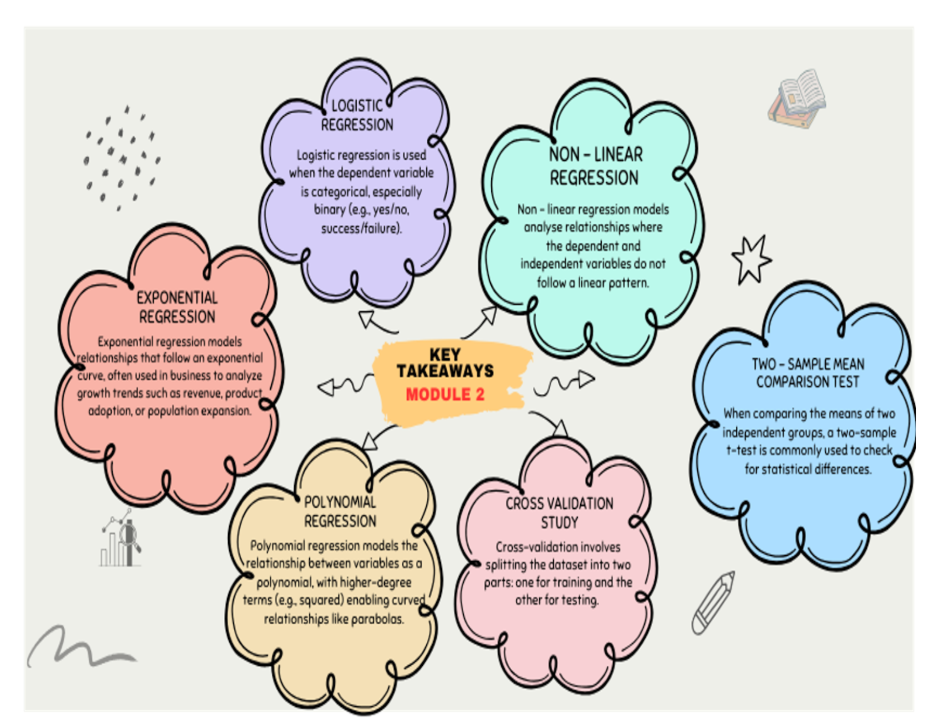
- Non-linear Regression: A form of regression analysis where the observational data are modeled by a function which is a nonlinear combination of the model parameters and depends on one or more independent variables. Often involves transforming variables (e.g., using logarithms) or using inherently non-linear models.
- Dummy Variables: Numerical variables (typically 0 or 1) used in regression analysis to represent subgroups of the sample (e.g., categorical variables like gender or treatment group).
- Log Odds: The logarithm of the odds ratio (), where p is the probability of an event occurring. Used as the dependent variable in logistic regression.
- Interaction Effects: Occur when the effect of one predictor variable on the dependent variable differs depending on the level of another predictor variable.
- Cross-validation: A resampling procedure used to evaluate machine learning models on a limited data sample, assessing how the results of a statistical analysis will generalize to an independent dataset.
Advanced Regression Techniques
Polynomial Regression
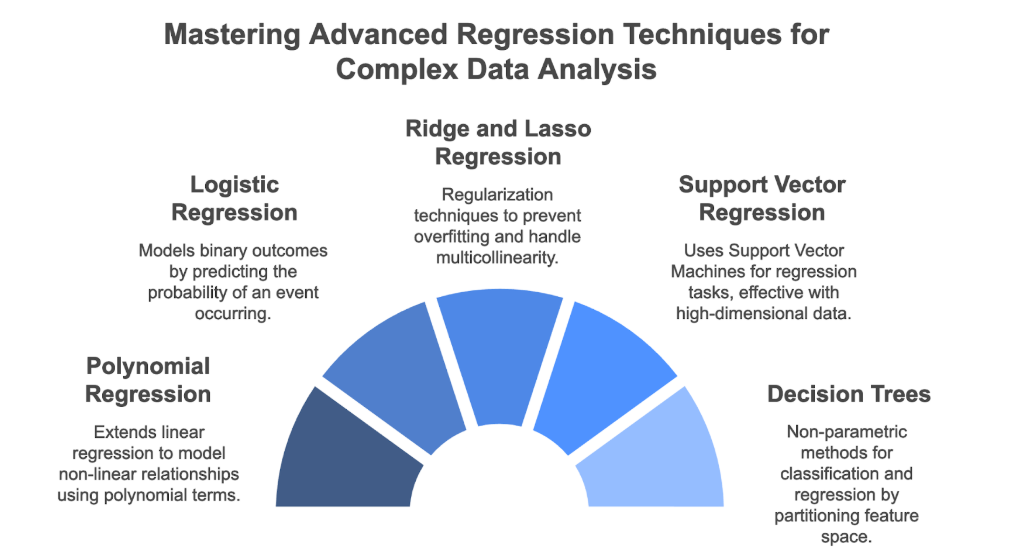
- Definition: Extends linear regression by adding polynomial terms (squared, cubed, etc.) of the independent variables to model non-linear, curved relationships.
- Key Insights: Allows fitting curves to data rather than just straight lines. The degree of the polynomial determines the complexity of the curve.
- Formula:
- Examples: Including for a quadratic relationship or for a cubic relationship.
Logistic Regression
- Definition: Used when the dependent variable is binary (e.g., 0/1, yes/no, success/failure). It models the probability of the outcome occurring.
- Key Insights: Models the log odds of the outcome as a linear combination of predictors. Parameter estimation often uses maximum likelihood. Coefficients represent the change in log odds for a one-unit change in the predictor. Can incorporate categorical predictors using dummy variables.
- Formula: (where p is the probability of the outcome).
- Examples: Predicting customer churn (yes/no), loan default (yes/no), disease presence (yes/no). Using Excel Solver to maximize log likelihood.
Ridge and Lasso Regression
- Definition: Regularization techniques used to handle multicollinearity and prevent overfitting, especially useful when dealing with a large number of predictors.
- Key Insights: They add a penalty term to the loss function to shrink coefficient estimates towards zero (Lasso can shrink them exactly to zero, performing variable selection).
Support Vector Regression (SVR)
- Definition: An extension of Support Vector Machines used for regression problems.
- Key Insights: Effective for both linear and non-linear regression tasks, particularly strong with high-dimensional data.
Decision Trees
- Definition: Non-parametric supervised learning methods that can be used for both classification and regression.
- Key Insights: Partition the feature space into a set of rectangles and fit a simple model (like a constant) in each one.
Variable Selection
Purpose
- Definition: The process of identifying the most influential predictor variables from a larger set for use in a regression model.
- Key Insights: Aims for model parsimony (simplicity) without sacrificing predictive or explanatory power. Improves interpretability and computational speed.
Forward Selection
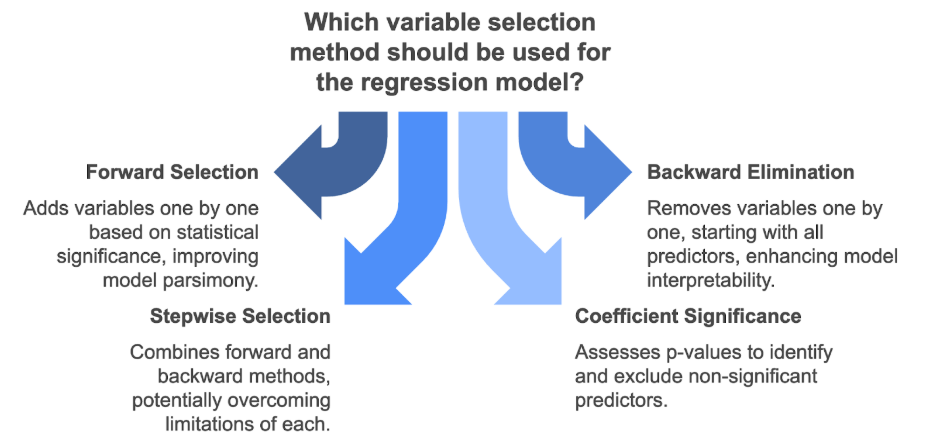
- Definition: An iterative variable selection procedure that starts with no predictors and adds the most statistically significant variable at each step.
- Key Insights: Variables are added one by one based on a chosen criterion (e.g., improvement in R-squared, reduction in RSS). Stops when adding variables offers no significant improvement.
Backward Elimination
- Definition: An iterative procedure that starts with all candidate predictors in the model and removes the least statistically significant variable at each step.
- Key Insights: Variables are removed one by one based on a chosen criterion (e.g., highest p-value above a threshold, change in R-squared, ANOVA). Stops when all remaining variables are statistically significant.
Stepwise Selection
- Definition: A hybrid approach that combines forward selection and backward elimination.
- Key Insights: At each step, considers adding a significant variable or removing an insignificant one. Can potentially overcome some limitations of pure forward or backward methods.
Coefficient Significance Assessment
- Definition: A simpler approach where a single model with all potential predictors is fitted.
- Key Insights: Examines the p-values of the coefficients. Predictors with non-significant p-values (typically > 0.05 or another chosen alpha level) are considered less important and may be excluded. Interpretation relies on the remaining significant variables.
Applications and Advanced Considerations
Business Decision Making
- Key Insights: Regression models are vital for identifying variable relationships, predicting future outcomes (e.g., sales, demand), optimizing strategies, and understanding complex phenomena.
- Examples: Analyzing customer behavior, predicting employee retention, optimizing pricing strategies, assessing financial risk (e.g., probability of default).
Comparing Means using Linear Regression
- Definition: Using linear regression with a binary dummy variable (0/1) representing group membership to test for significant differences in the mean of a continuous outcome variable between two groups.
- Key Insights: The coefficient () of the dummy variable directly represents the estimated difference in means between the groups. Offers flexibility over traditional t-tests by allowing the inclusion of covariates to control for confounding factors. Related to the concept of fixed effects.
- Formula: , where D is the binary group indicator (0 or 1). estimates .
- Comparison: More flexible than standard t-tests or Wilcoxon tests as it easily accommodates additional control variables.
Interaction Effects
- Definition: Assessing whether the relationship between one predictor and the outcome depends on the level of another predictor.
- Key Insights: Allows for more nuanced understanding of relationships (e.g., does the effect of resale status on house price differ depending on who posted the listing?).
Non-Linear Transformations
- Definition: Applying mathematical functions (e.g., logarithm, square root) to the dependent or independent variables.
- Key Insights: Used to address non-linearity in relationships or non-normality/heteroscedasticity in residuals. Aids in satisfying model assumptions. Interpretation of coefficients changes based on the transformation applied.
- Examples: Using log(price) or log(price per square foot) as the dependent variable when the price distribution is skewed. Using log(area) as a predictor.
Model Evaluation
- Key Insights: Assessing model fit and reliability involves checking assumptions (e.g., linearity, independence, normality, equal variance of errors) and using evaluation metrics. Techniques like cross-validation help assess how well the model generalizes to new data.
- Examples: Checking normality of price distribution using histograms (Bangalore case study). Comparing different models (e.g., with/without transformations or interactions) using cross-validation.

Conclusion
Advanced regression methods provide a powerful toolkit for analyzing complex data structures beyond the scope of simple linear models. Techniques like polynomial and logistic regression address non-linear relationships and binary outcomes, while regularization methods manage multicollinearity and overfitting. Effective variable selection ensures model parsimony and interpretability. Understanding transformations, interaction effects, and robust model evaluation techniques like cross-validation are crucial for building reliable predictive models that drive informed decision-making in various practical applications.