Non-Parametric Methods
Module 1
Core Concepts
- Statistical tests are classified into parametric and non-parametric based on assumptions about the underlying population distribution.
- Parametric tests assume data follows a specific distribution (e.g., normal) and estimate population parameters (mean, variance).
- Non-parametric tests are distribution-free, making them robust alternatives when parametric assumptions are violated (e.g., non-normality, outliers, small samples).
- Non-parametric methods often utilize data ranks rather than actual values.
- The choice depends on data characteristics; parametric tests offer parameter estimates, while non-parametric tests provide reliability when assumptions fail.
- Both test types aid in summarizing data, identifying relationships, and testing hypotheses.
Definitions
- Parametric Tests: Statistical methods assuming data originates from a specific probability distribution (e.g., normal) and involving the estimation of population parameters.
- Non-Parametric Tests: Statistical methods that do not rely on assumptions about the population distribution; often called distribution-free tests.
- Population Parameters: Numerical characteristics of a population (e.g., mean (μ), standard deviation (σ), proportion (p)).
- Ranks: The relative position or order of data points when sorted.
Chi-Square Test of Independence
Chi-Square Test of Independence - Definition
A non-parametric method used to determine if a statistically significant association exists between two categorical variables.
Chi-Square Test of Independence - Key Insights
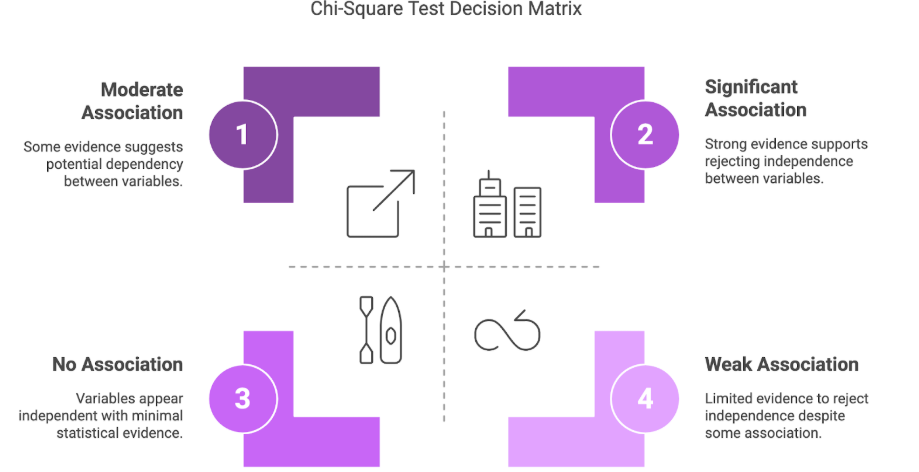
- Tests the null hypothesis (H0) that the two variables are independent against the alternative hypothesis (H1) that they are dependent.
- Compares observed frequencies (from sample data in a contingency table) with expected frequencies (calculated assuming independence).
- The test statistic quantifies the discrepancy between observed and expected counts.
- Decision (reject/fail to reject H0) is based on comparing the test statistic to the chi-square distribution with (rows-1) * (columns-1) degrees of freedom.
- Continuous variables must be discretized (grouped into categories) before applying this test.
- Independence implies that the occurrence of one variable's category does not influence the probability of the other variable's category occurring.
Chi-Square Test of Independence - Examples
- Examining if airline ticket class (economic, business, first) is associated with travel type (domestic, international).
- Assessing if salary distributions differ significantly across various company departments.
- Testing if employee satisfaction level is independent of categorized average monthly hours worked.
Chi-Square Test of Independence - Formula
- Chi-Square Statistic (χ²):
∑ [(Oᵢⱼ - Eᵢⱼ)² / Eᵢⱼ]
- Oᵢⱼ = Observed frequency in cell (row i, column j)
- Eᵢⱼ = Expected frequency in cell (row i, column j)
- Expected Frequency (Eᵢⱼ): (Row i Total * Column j Total) / Grand Total
Goodness of Fit Test
Goodness of Fit Test - Definition
A statistical test to assess how well observed sample data fits a hypothesized theoretical probability distribution (e.g., uniform, Poisson, normal).
Goodness of Fit Test - Key Insights
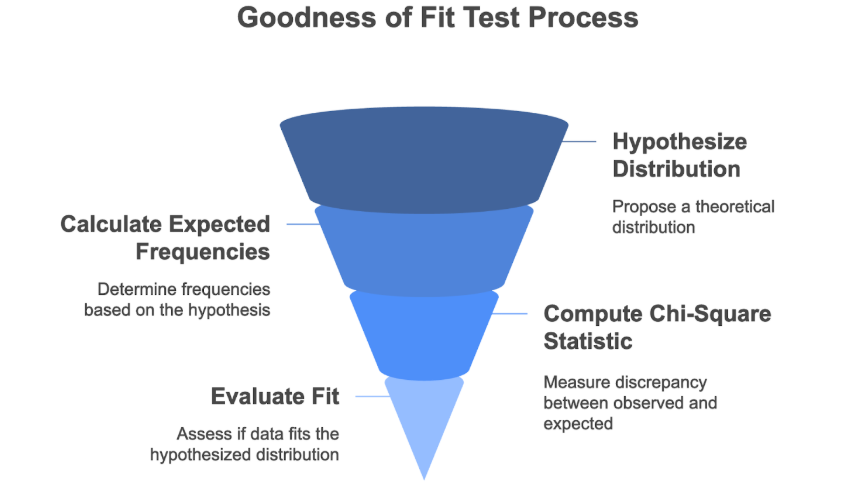
- Compares the observed frequency distribution from the sample against the expected frequency distribution derived from the hypothesized theoretical distribution (H0).
- The alternative hypothesis (H1) states the data does not follow the specified distribution.
- Requires grouping continuous data into intervals/categories to obtain observed frequencies for comparison.
- Expected frequencies are calculated based on the probability of each category under the assumed distribution.
- Uses a chi-square test statistic to measure the discrepancy between observed and expected frequencies.
Goodness of Fit Test - Examples
- Testing if employee satisfaction scores are uniformly distributed between 0 and 1.
- Determining if the number of projects assigned per employee follows a Poisson distribution.
- Validating if historical sales data conforms to a specific distribution to inform forecasting models.
Goodness of Fit Test - Formula
- Chi-Square Statistic (χ²): ∑ [(Observed Frequency - Expected Frequency)² / Expected Frequency] (Summation is across all categories/intervals)
Wilcoxon Signed Rank Test
Wilcoxon Signed Rank Test - Definition
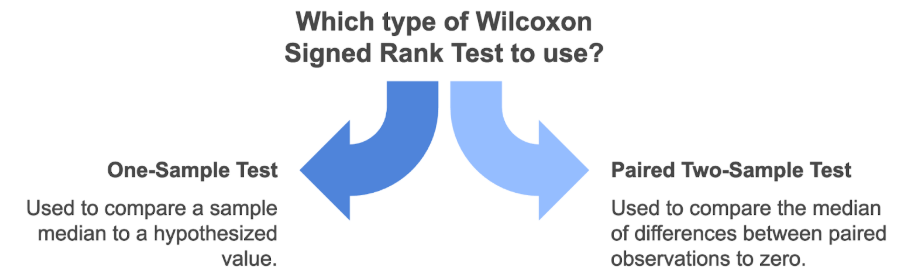
A non-parametric test used for one-sample or paired two-sample scenarios to assess hypotheses about the median.
- One-Sample: Tests if the sample median differs significantly from a specific hypothesized median value.
- Paired Two-Sample: Tests if the median of the differences between paired observations is significantly different from zero.
Wilcoxon Signed Rank Test - Key Insights
- Does not assume data follows a normal distribution; suitable for non-normal data or small sample sizes.
- Based on ranking the absolute values of the differences (observation vs. hypothesized median, or paired differences).
- Uses the signs (+/-) of the original differences, applied to the ranks.
- The test statistic (W) is typically the sum of positive ranks (W+) or negative ranks (W-).
- If H0 (no difference in medians) is true, W+ and W- are expected to be similar.
- For large samples (n > 30), the test statistic (W+) approximates a normal distribution, allowing the use of a Z-score.
Steps for Calculation
- Compute differences: (Observation - Hypothesized Median) or (Observation Pair 1 - Observation Pair 2).
- Discard zero differences.
- Rank the absolute values of the non-zero differences, assigning average ranks for ties.
- Apply the original sign (+ or -) of the difference to its corresponding rank.
- Sum the ranks with positive signs (W+) and/or the ranks with negative signs (W-).
Formula (Large Sample Approximation, n > 30)
- Mean of W+: μ(W+) = n(n + 1) / 4
- Z-Score: Z = (W+ - μ(W+)) / Standard Error(W+) (Note: The specific formula for Standard Error(W+) depends on ties and is derived from the properties of ranks, but its detailed calculation was not provided in the source summary.)
Conclusion
Parametric and non-parametric tests offer distinct approaches to hypothesis testing, differentiated primarily by their assumptions regarding data distribution. While parametric tests estimate population parameters assuming specific distributions, non-parametric methods like the Chi-Square tests (for independence and goodness of fit) and the Wilcoxon Signed Rank test provide robust, distribution-free alternatives. These non-parametric techniques are particularly valuable for analyzing categorical data, assessing distributional fit, or comparing medians when parametric assumptions are untenable, offering flexible tools for data analysis in diverse real-world scenarios.